Health
Breast & Cervical Cancer
Rental Housing
Violent Crime
Self-Sufficiency
Basic Needs
Physical Activity
Nutrition
Minorities
Mental Health
Childhood Immunizations
Heart Disease
Health Care Coverage
Feeling Well
Traffic Crashes
Communicable Diseases
|
Why This Measure?
Access to medical care is a vital component of a healthy community. Given the high cost
of medical services, treatment is often prohibitively expensive for those without health
care coverage. While some people may obtain medical treatment through Medicare or other
government-sponsored programs, many members of our community — in particular females,
young adults, the working poor — have no coverage and do not use medical services
because they can’t pay. The consequences of inaccessible health care are serious:
wellness care (regular checkups) can prevent many health problems; illnesses relatively
inexpensive to treat with early diagnosis may, without medical intervention, escalate to
emergency status at great personal and financial cost. Lack of medical services also
breeds isolation among people who may already feel alone and abandoned.
Lead Indicator

Source: Montana BRFSS, 1998
Health
Care Access |
|
|
|
|
|
|
No
health insurance |
|
|
Couldn't
afford doctor |
|
% |
|
|
in
past year |
All
Adults : |
|
|
|
|
1997 |
15 |
|
|
13 |
1998 |
17 |
|
|
13 |
Combined |
16 |
|
|
13 |
|
|
|
|
|
|
|
|
|
|
Male |
17 |
|
|
10 |
Female |
15 |
|
|
16 |
|
|
|
|
|
Age: |
|
|
|
|
18-29 |
26 |
|
|
16 |
30-44 |
20 |
|
|
16 |
45-64 |
15 |
|
|
13 |
65+ |
1 |
|
|
5 |
|
|
|
|
|
Education: |
|
|
|
|
<
High School |
19 |
|
|
19 |
High
School |
20 |
|
|
14 |
Some
College |
17 |
|
|
14 |
College
Degree |
9 |
|
|
8 |
|
|
|
|
|
Income: |
|
|
|
|
<$10,000 |
38 |
|
|
30 |
$10,000
- $19,000 |
31 |
|
|
26 |
$20,000
- $34,000 |
17 |
|
|
15 |
$35,000
- $49,000 |
9 |
|
|
10 |
$50,000+ |
5 |
|
|
3 |
|
|
|
|
|
Race: |
|
|
|
|
White,
non-Hispanic |
16 |
|
|
13 |
Non-white
or Hispanic |
19 |
|
|
21 |
Source: Montana BRFSS, 1998
How
are we doing?
Holding steady with too many still
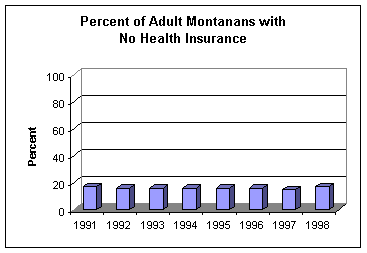
underinsured. In 1998 17% of Montana adults reported they were uninsured.
(Remember that only 1% of adults 65 and older are uncovered due to
Medicare). Missoula’s population is growing, so the number of people
without coverage is growing too, even if the percentage remains the same.
Once again, those with less income and education are less insured.
Programs like Missoula’s Partnership Health Center which provides health
care to underinsured and Covering Kids (Missoula’s approach to CHIP-the
Children’s Health Insurance Plan) are helping. But many health care
needs are going unmet, and health continues to be compromised as a result
.
Trend Same Data Rating Available vv Reliablevv Relevantvvv
Dental Care/Insurance
In 1996, 56% of Missoulians had dental insurance. However,
35% of Missoulians did not visit a dentist that year due to cost.
Long Time No Insurance
The 1997 Missoula BRFS Survey indicated the length of time
since currently uninsured Missoulians had had coverage:
1–6 months15%
6–12 months 15%
1–2 years 9%
2–5 years 20%
5 or more years 34%
Never 7%
Source: Missoula BRFSS, 1997
Sources of Missoula Health Care
Coverage
Your employer 5 5%
Other’s employer 1 8%
Private plan 1 7%
Medicaid 4% (the state indicates about 6500 are enrolled
in Missoula County-7% of current population)
Military 3%
I ndian Health Service 1%
Other 3%
Source:
Missoula BRFSS, 1997no health insurance and relied on self-pay, county and
local programs, or charity.

Medicaid
| The
Medicaid program has grown in both size and complexity
since its inception in 1965.The program now accounts for
about 15 percent of all health care spending ($188
billion in 1999) and covers 36 million people, primarily
with four major types of coverage:
1. acute
medical insurance coverage
2.
coverage for the disabled, including residential care
for the long-term mentally disabled
3.
long-term care for the poor elderly (those who have
"spent down" to poverty level and need nursing
home care)
4. state
Medicaid programs paying the Medicare Part B insurance
premiums for poor elderly and disabled (known as dual
eligibles)
Sixty-five
percent of people enrolled in Medicaid are in the first
category, and 65 percent of the money is spent on the 35
percent in the last three categories. As that spending
tends to fall outside of the traditional acute care
model, it is difficult to include in managed care
programs.
A series
of legislated eligibility expansions in the late 1980s,
followed by the 1990-1992 recession, increased the
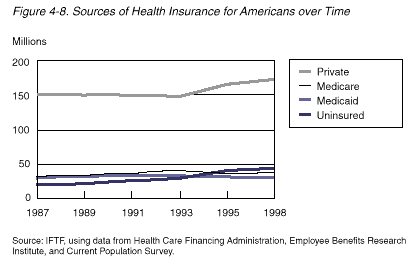
number of people covered by Medicaid from 23 million in
1987 to 36 million in 1996. Currently, about 28 million
people use Medicaid as their primary source of health
insurance (our model counts the dual eligibles in the
Medicare numbers). Federal legislation in 1996 gave
states far more freedom to alter Medicaid plans, both in
terms of implementing new benefit arrangements and in
changing eligibility levels. Meanwhile several states,
notably Tennessee, had already moved their Medicaid
population into managed care programs. Most
other states have announced an intention to do the same,
and we forecast that about 60 percent of Medicaid
recipients will be in managed care plans by 2005,
although they will account for only 35 percent of
spending.
The 1997
Balanced Budget Act also gave the states funding to
increase the number of children covered by health
insurance. States may use these funds to increase
Medicaid eligibility levels for children or they may
create separate child health programs.
Source
Robert Wood Johnson Foundation: Health & Health Care
2010
|
|
|