![]()
![]()
Health
Life Expectancy
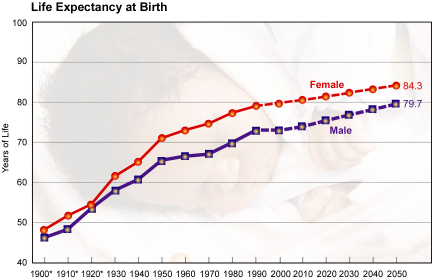
Life expectancy is the average number of years people born in a given year are expected to live based on a set of age-specific death rates. At the beginning of the 20th century, life expectancy at birth was 47.3 years. Fortunately, life expectancy has dramatically increased over the past 100 years (see figure 1). Today, the average life expectancy at birth is nearly 77 years.
Figure 1. Past and projected female and male life expectancy at birth, United States, 1900-2050
Life expectancy for persons at every age group has also increased during the past century. Based on today's age-specific death rates, individuals aged 65 years can be expected to live an average of 18 more years, for a total of 83 years. Those aged 75 years can be expected to live an average of 11 more years, for a total of 86 years.
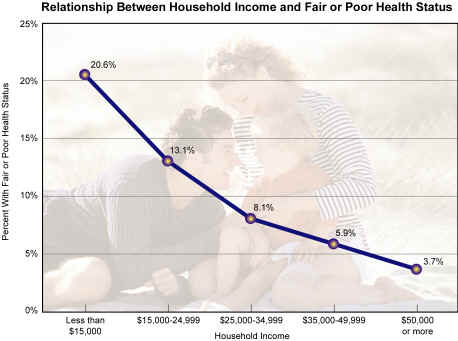
Differences in life expectancy between populations, however, suggest a substantial need and opportunity for improvement. At least 18 countries with populations of 1 million or more have life expectancies greater than the United States for both men and women. There are substantial differences in life expectancy among different population groups within the United States. For example, women outlive men by an average of 6 years. White women currently have the greatest life expectancy in the United States. The life expectancy for African American women has risen to be higher today than that for white men. People from households with an annual income of at least $25,000 live an average of 3 to 7 years longer, depending on gender and race, than people from households with annual incomes of less than $10,000.
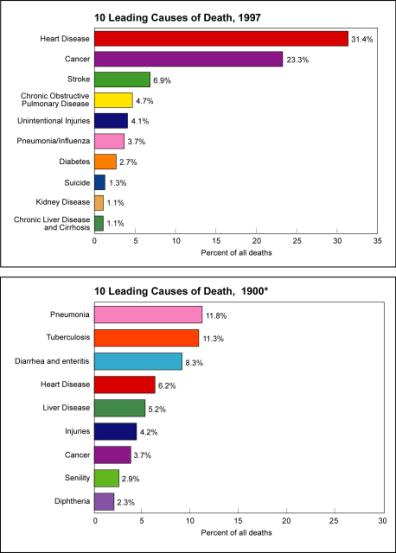
Leading Causes of Death
The 10 leading causes of death as a percentage of all deaths in the United States, 1900 and 1997
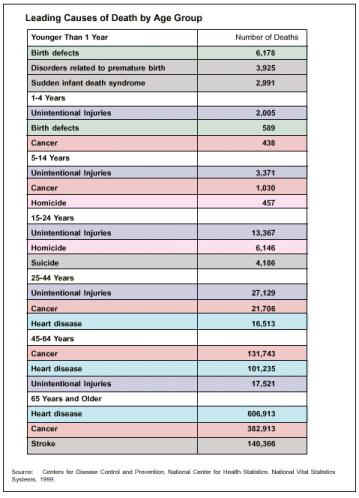
The 3 leading causes of death by age group, United States, 1997
Ten Leading Causes of Death in Montana (also available for other states) http://www.cdc.gov/ncipc/osp/leadcaus/mttable.htm
Percentage of persons with fair or poor perceived health status by household income, United States, 1995.
Home | Domestic Violence | HealthCopyright 1999-2018 Missoula County