Health
Breast & Cervical Cancer
Rental Housing
Violent Crime
Self-Sufficiency
Basic Needs
Physical Activity
Nutrition
Minorities
Mental Health
Childhood Immunizations
Heart Disease
Health Care Coverage
Feeling Well
Traffic Crashes
Communicable Diseases
|
Why This Measure?
Motor vehicle crashes are the leading cause of all
deaths resulting from injury. Aside from pain and loss, there are huge health and economic
impacts associated with crashes. Traffic crashes happen for a variety of reasons, most of
which have to do with people rather than engineering or environmental conditions. The vast
majority of the injuries and deaths are not acts of fate, but are predictable and
preventable.
How Are We Doing?
Traffic crashes in Missoula County continue
to rise along with the increase in population and vehicle miles traveled. The State
Traffic Safety Bureau’s Traffic Safety Problem Identification Report has
ranked Missoula County as number one in the State for severe injury crashes (those
involving a fatality or incapacitating injury) each year since 1994. Of the 2,217 crashes
reported in 1997, 224 were classified as "severe" crashes. In comparison,
Yellowstone County ranked second in the state for severe injury crashes in 1997 with a
total of 139. Key contributing factors: speed too fast for conditions, failure to yield
the right of way, and impaired (alcohol, drugs, etc.) driving.
Trend Slightly Worse Data Rating
Available Reliable Relevant
Source: Montana Traffic Safety Bureau,
MDOT
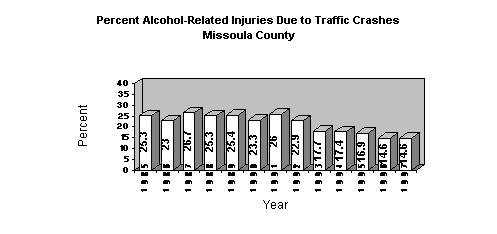
Over the past decade, there has been a dramatic decline in alcohol involvement in
crashes in Missoula County. Of the 2,294 traffic crashes reported in Missoula County
during 1998, 217 (9%) involved alcohol compared to 1987 when 18% of reported crashes
involved alcohol.
BAC: The average BAC of persons arrested for DUI in
Missoula County during 1998 was .17 -- a significant improvement over the .22 average BAC
of those arrested for DUI in Missoula County throughout 1991 and 1992.
Refusals: During 1998, 24% of those arrested for DUI in
Missoula County refused to have their BAC measured at time of arrest. The refusal rate in
Missoula County during the early 90's ran right around 35%.
Public Support of DUI Enforcement: Over 96% of respondents to a 1996 State
Traffic Safety Public Opinion Survey responded "yes" when asked if they support
strict law enforcemnt of DUI.
Promising strategies to reduce the number of traffic crashes, as well as the DUI
problem, include: Strategic Enforcement Patrols; We Share the Road, Missoula—a
Missoula Traffic Safety Task Force public information campaign; Crashes Aren’t
Accidents—a National Highway Traffic Safety Advisory public information campaign;
and the SoBear University of Montana Designated Driver Program.
Seat Belts
OCTOBER 1999 MISSOULA SEAT BELT USAGE RATE
– 63%
Combination lap and shoulder belt systems reduce the chance
of serious injury or death in a crash by about 50%; lap belts alone by about 35%. In 1994,
78% of the motor vehicle occupants killed in traffic crashes in the county were not
buckled up.
Kids and Cars
Motor vehicle crashes are the leading cause of death for
Montana children from 1 to 15 years old. In Montana during 1997 (the latest year for which
complete data is available) one child was killed and an additional 90 children injured
each month in a motor crash (Montana Kids Count, Healthy Mothers/Healthy Babies,
1999). Nationally, 4 out of 5 child safety seats are used wrong. Almost 98% of the child
safety seats checked at ongoing Safety Seat Inspection Clinics held for the past two years
in Missoula and surrounding communities were being used incorrectly.
In addition to ongoing Child Safety Seat Inspection Clinics
held from Spring through Fall in Missoula and surrounding communities, promising
developments include upgrading of the State Child Passenger Safety Law, Strategic
Enforcement Patrols, State Child Occupant Protection Plan (COPP) Task Force (5 members
from Missoula), and increased accessibility to NHTSA’s Standardized Child Passenger
Safety Training Program (4 day course) for EMTs, law enforcement personnel, child safety
seat retailers, and other professionals in the field.
Teens and Cars
Montana has the highest rate of teen traffic
fatalities in the nation: 49.9 per 100,000 population compared to the national average of
31 (National Highway Traffic Safety Administration, 1998). Traffic crashes are the number
one cause of death for youth. The crash rate per mile for teenagers is four times higher
than for adults. Teens are allowed to get licenses at an early age with little driving
experience. In 42 states, the minimum driver age is at least 16: in Montana, it is 15
(Insurance Institute for Highway Safety, 1995).
During 1997, Montana drivers between 15 and 20 years of age were involved in 129
crashes per thousand licensed drivers. Each higher age group had fewer crashes per
licensed driver than the previous. For each year between 15 and 20, the rate improves,
which tends to support that lack of driving experience is a strong factor in teen traffic
crashes—a stronger factor than alcohol (Montana Traffic Safety Bureau’s Traffic
Safety Problem Identification Report, 1998).
Speed Kills
Crash severity increases
proportionally based on the speed of vehicle at impact. Because of this, the chances of
being killed or seriously injured doubles for every 10 miles per hour over 50. The
benefits of occupant protection devices, such as seat belts and child seats, diminish as
the speed of a vehicle increases (NHTSA).
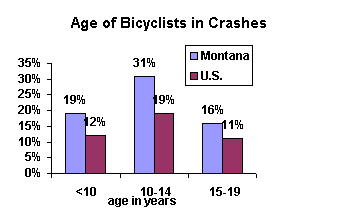
Bicycle Crashes
Montana is doing pretty good in the number of bicycle crashes, compared to the national
average: In Montana, 1% of crashes involve bikes. Nationwide, 2% of crashes involve
bicycles. However, more Montana children are involved in bicycle crashes than the national
average. Any guesses as to why over 80% of bicycle injuries and fatalities
involve male bicyclists? Males have a higher rate of pedestrian/vehicle collisions, too.
They make up over 2/3 of the pede
The new bike lanes are intended to serve as a visible reminder
to both motorists and bicyclists that bikes belong on the road. However, bicyclists must
still follow the same rules as motor vehicles. Even in a bike lane, bikes must go in the
same direction as traffic and obey all traffic control devices.
- Motorists may not park in bike lanes, and are expected to stay out of bike lanes except
when accessing parking spaces, driveways, streets or alleys.
- Bike lanes are not for pedestrians---they belong on the sidewalk.
- Roller blades and skate boards are not legally vehicles, so therefore cannot use bike
lanes or traffic lanes.
- Bicyclists are not required to use bike lanes. They may use any portion of the
roadway. Most of our streets do not have specific bikeway designations.
- When planning to make a left turn, bicyclists must leave the bike lane well in advance.
- Although there are may bike routes, and some roads have specific bike lanes, we must all
share the road respectfully.
|